Gantt charts are super popular with project management, and their use in the construction field is no exception. If you’re working with a big team, paid solutions like TeamGannt or Basecamp are good ways to keep track of tasks. But what if you just want a quick way to visualize the near future? Something that can be embedded on your blog. Without JavaScript. For free. Enter Mermaid. With the help of Gulp and Hugo, we can make updating Gantt charts on our web site as simple as saving a text file.
To see this in action, view our construction log.
INSTALL & TEST MERMAID
First things first, install Mermaid. I use npm, so I simply:
cd /Documents/Sites/path_to_my_site
npm install mermaid
Likewise, Mermaid CLI should be installed which allows Mermaid to be run from the command line instead of from JavaScript.
npm install mermaid.cli

// Verify install was succesful:
./node_modules/.bin/mmdc -h
Make note of the ./node_modules... path because it is needed to call the script from Gulp. After that, create a test Gantt chart called timeline.mmd in the same directory. Just copy / paste the example from their documentation. Or, if you want to try your own content, their live editor is a handy tool to mock up charts.
gantt
	title A Gantt Diagram
	dateFormat  YYYY-MM-DD
	section Section
	A task           :a1, 2014-01-01, 30d
	Another task     :after a1  , 20d
	section Another
	Task in sec      :2014-01-12  , 12d
	another task      : 24d
Finally, test Mermaid by building it in the command line:
./node_modules/.bin/mmdc -i timeline.mmd -o output.svg
Starting 'mermaid'...
Finished 'mermaid' after 583 ms
BUILD WITH GULP
Once Mermaid is installed and can be built from the command line, the next step is to build from Gulp. To do that, I’m using gulp-run-command, which allows Gulp to run command line actions. In the same project directory, install with:
npm install gulp-run-command
Now, when our site builds with gulpfile.js, the Gantt charts can be generated. My Gulp task looks like:
var run = require('gulp-run-command').default;
gulp.task('mermaid', run('./node_modules/.bin/mmdc -i timeline.mmd -o themes/journal/layouts/partials/timeline.svg -c mermaid.json', {}));
Every time my site is built, or if I manually test with gulp mermaid, the SVG file will be saved to the path listed. You’ll also notice -c mermaid.json is being passed in. That is for a config file. To use a custom config file, create mermaid.json in the same directory, and start with:
{
	"gantt": {
		"titleTopMargin": 50,
		"barHeight": 30,
		"barGap": 10,
		"topPadding": 50,
		"sidePadding": 0,
		"gridLineStartPadding": 40
	}
}
Here is a reference for all config options.
ADD A HUGO SHORTCODE
At this point, we have SVG files being written to our directory every time the site is built. Adding the SVG file to your site can be as simple as <img src="timeline.svg" />, but that will not give us full control over styles. For styling, we have to add the actual SVG code. To do that with Hugo, a partial template can be used, but partials can not be included from content pages. So, we’ll use a shortcode instead for content pages. I created gantt.html in /layouts/shortcodes of my Hugo theme.
<div class="inlinePhoto full">
	<figure itemprop="associatedMedia" itemscope itemtype="http://schema.org/ImageObject" class="">
		{{ partial (printf "%s" ( .Get "chart" )) . }}
		<figcaption>
	        <p>
	            {{ .Get "caption" | markdownify }}
	        </p>
	    </figcaption>
	</figure>
</div>
Then, the shortcode is called in a content page with:
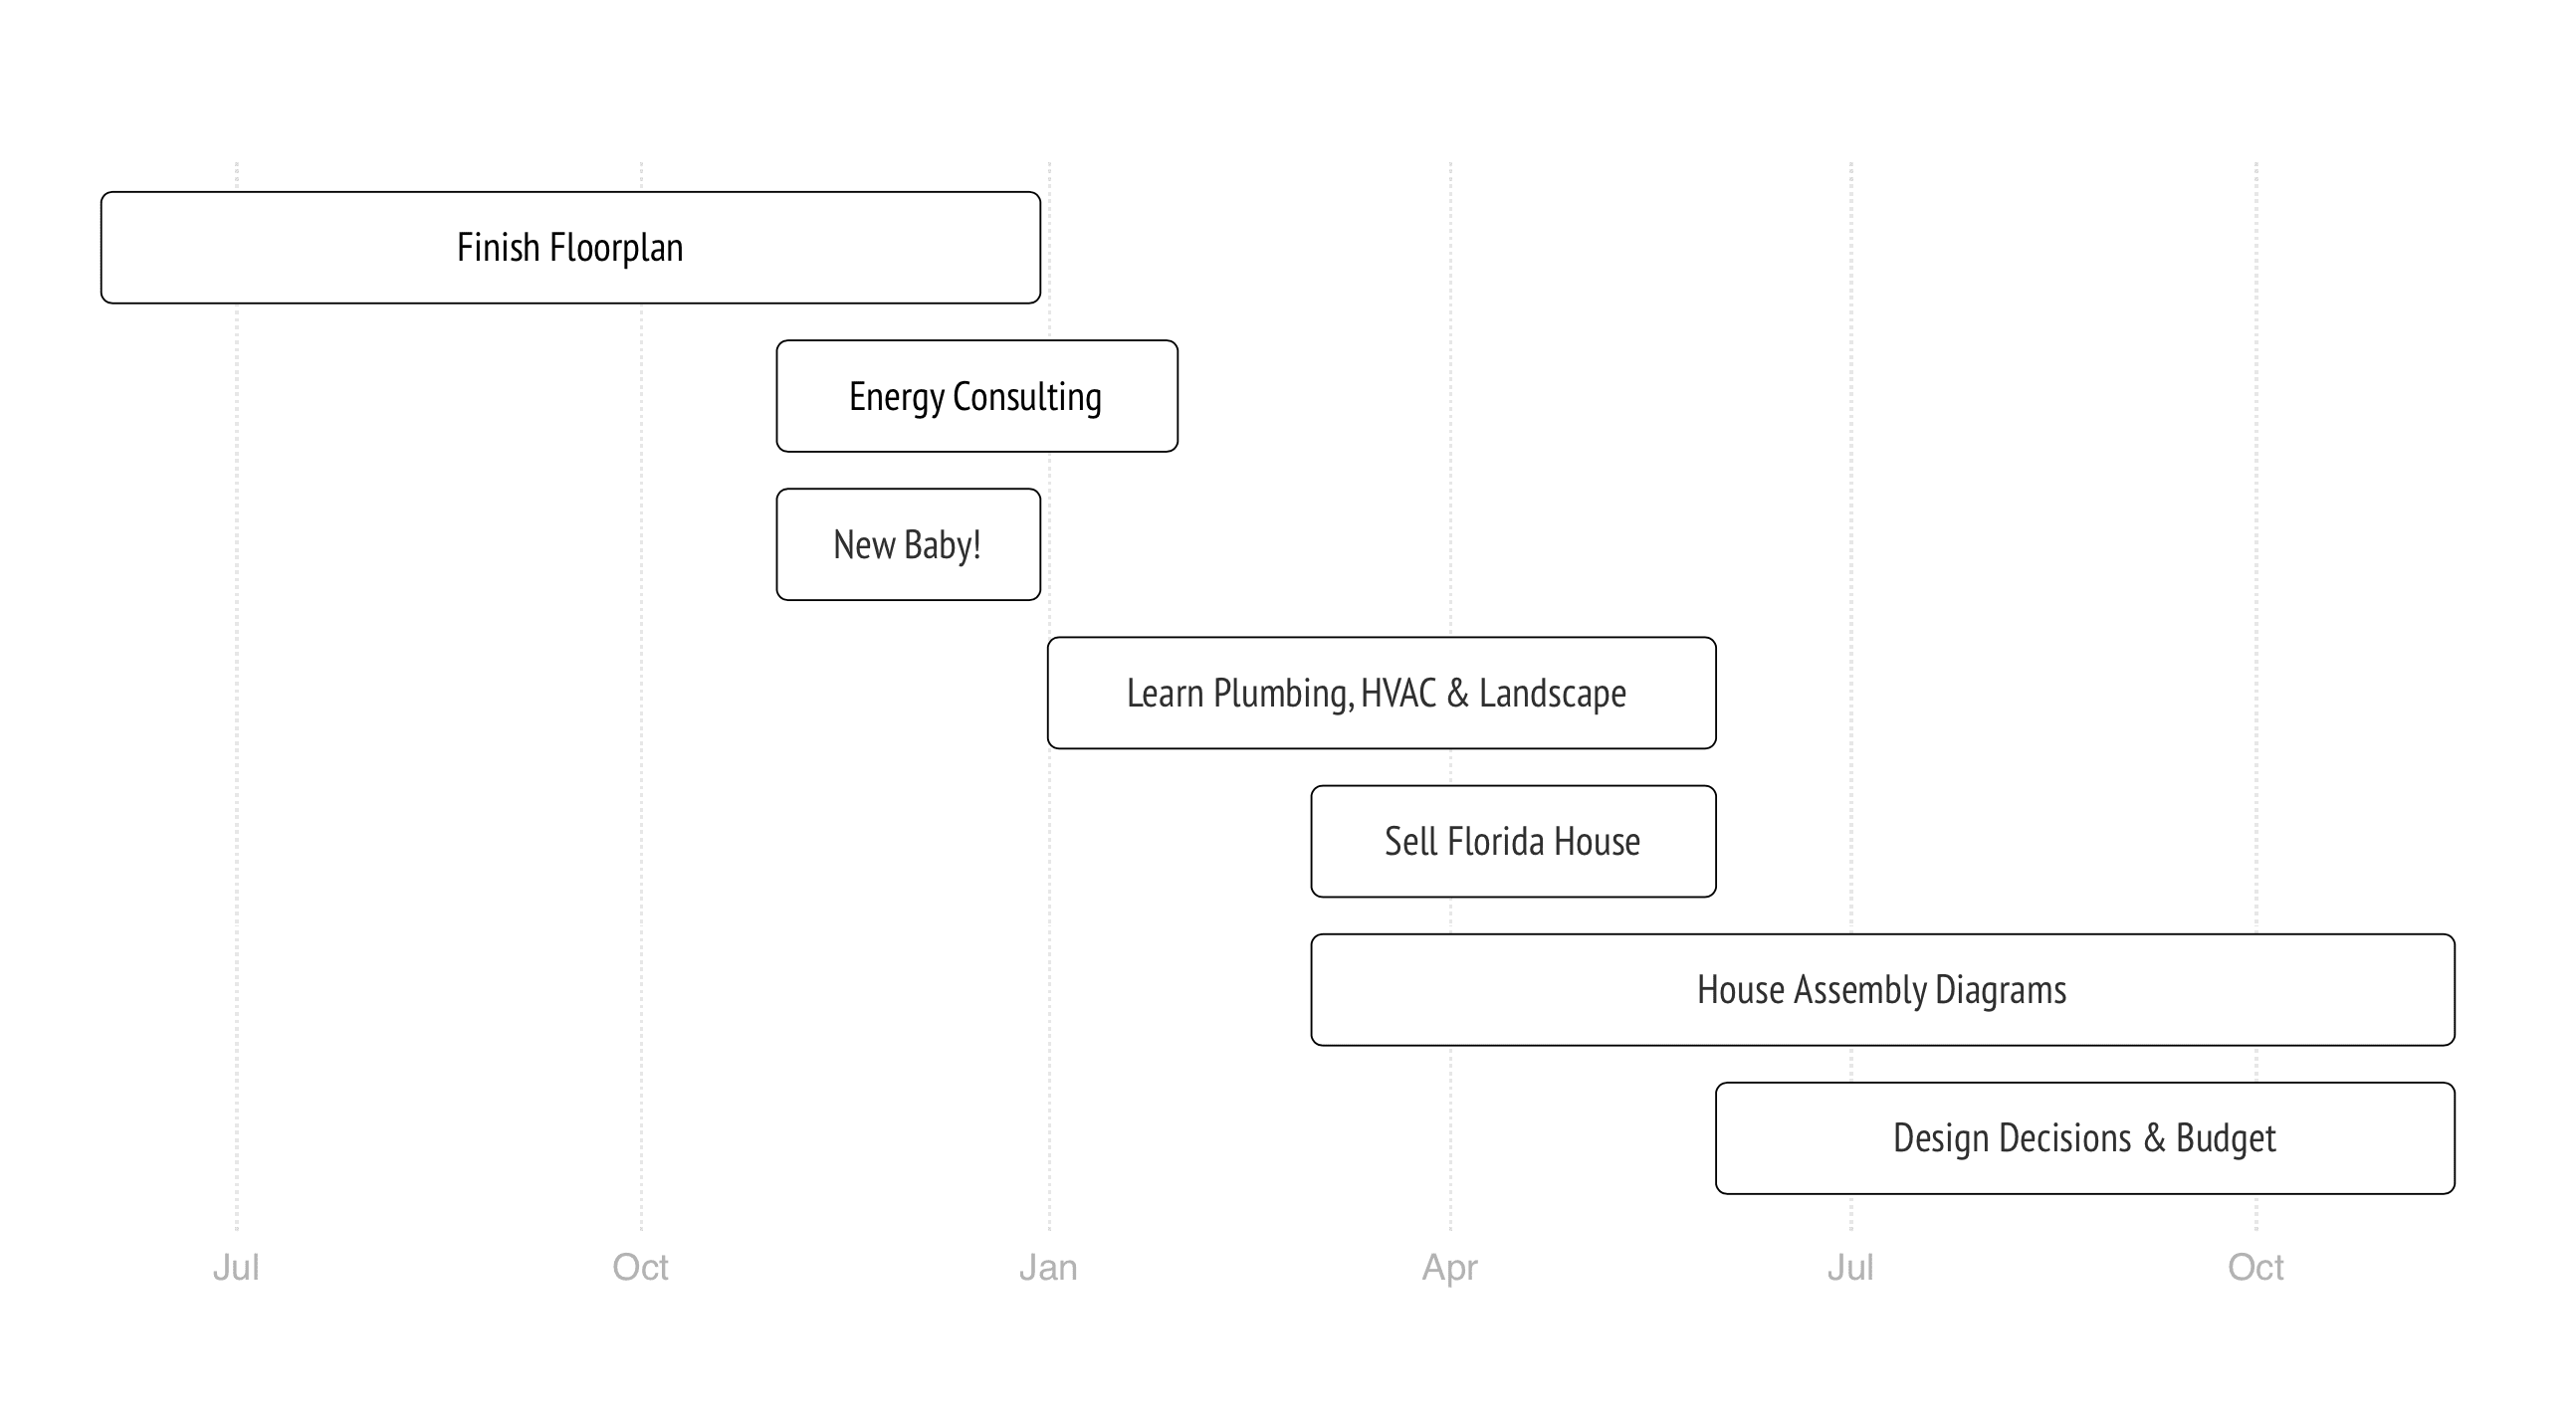
{{< gantt chart="timeline.svg" caption="2019-2020 Planning Timeline" >}}
Basically, the file name and caption are passed in. The actual SVG tags are then output, and not just an image. This comes with quite a few benefits:
- Everything is rendered for a static site – no JavaScript required.
- Simply edit and save a text file to change the chart content.
- No separate software to download to manage the charts.
- The charts can be styled to match the site exactly.
- By being part of the build process, the charts will be updated whenever anything in the site is touched.
Score one for JAMStack sites!
NOTES ON STYLING
SVG styles are a bit tricky if you’ve never worked with them before. I found this list of SVG properties to be handy. Then, when it comes to including the actual CSS file, I used my existing CSS structure and added !important tags as needed. The override is required because the SVG outputs with inline CSS, and I could not get the -C option working on the command line tool to provide an override CSS. Your experience may vary. With that in mind, the CSS for this site is:
.titleText, .sectionTitle {
    display: none;
}

.section {
    fill: white !important;
}

.taskText, .taskTextOutsideRight {
    @include proseFont();
    line-height: 35px;
    margin-bottom: 0;
    font-weight: 400;
    width: 100%;
    fill: $textBlack !important;

    @include breakpoint(full-screen) {
       line-height: 42px;
    }
}

.today {
    display: none;
}

.tick {
    border: 1px solid $black;
}

.task {
    stroke-width: 0.5 !important;
    stroke: $black !important;
    fill: white !important;
}

.grid .tick:nth-child(even) {
    //display: none;
}

.tick line {
    stroke-dasharray: 1;
    opacity: 0.4;
}